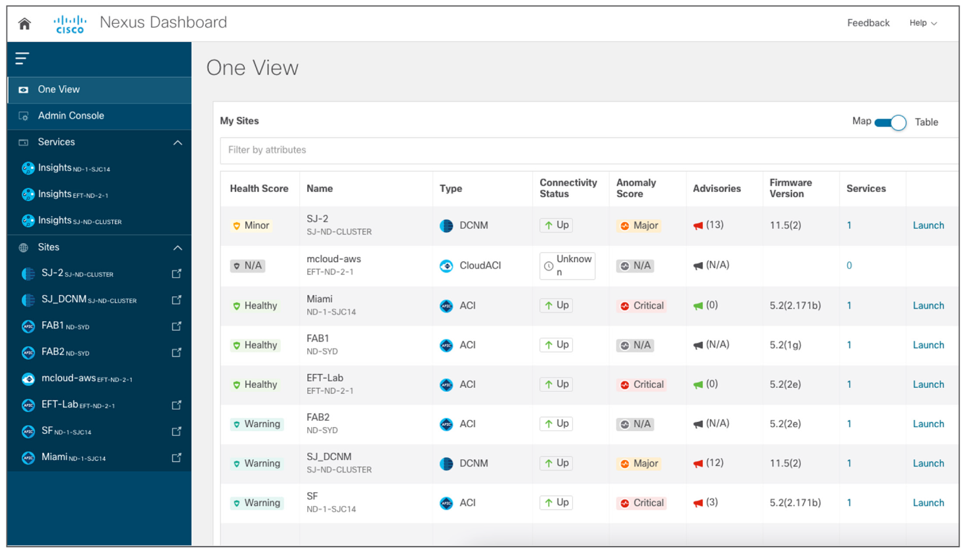
Unified Operations Across Environments
- Manages complex AI infrastructure spanning data centers, clouds, and edge locations.
- Enables streamlined, policy-driven operations across all layers of the network.
- Integrates seamlessly with Cisco ACI, NX-OS, and third-party tools for cross-domain management.
Simplified Deployment and Management
- Automated provisioning ensures fast, consistent deployment of AI and traditional workloads.
- Centralized configuration and monitoring across multiple environments from a single platform.
- Example: Easily deploy distributed AI training clusters with peak performance and minimal downtime.
Breaking Down Silos for Collaborative Teams
- Unifies NetOps, DevOps, and AIOps teams under a shared operational model.
- Provides a single pane of glass with role-based dashboards tailored to team needs.
- Supports third-party integrations like Splunk and Cisco Intersight for enhanced workflows.
|
Advanced Observability and Insights
- Real-time telemetry from switches, endpoints, and compute resources.
- AI-driven anomaly detection and predictive analytics to prevent disruptions.
- Flow analytics monitor latency, jitter, and packet loss for fine-tuned performance.
- Detailed GPU-to-GPU traffic visibility to optimize AI training workloads.
Assurance for Both Traditional and AI Workloads
- Intent-based proactive monitoring to maintain reliability and compliance.
- Upgrade validation before and after deployments to ensure smooth transitions.
- Compliance enforcement for performance and security baselines.
- Supports high-density 800G fabrics and emerging Ultra Ethernet standards.
Built for Scale, Speed, and Sustainability
- Supports high-performance Nexus 9000 series and 800G switching infrastructure.
- Congestion management with Priority Flow Control (PFC) for lossless networking.
- Simplified setup with automated lossless networking and scoring mechanisms.
- Tracks power usage and eco-efficiency to support sustainability goals.
|

